
How K-Means Clustering Works with Image Colors
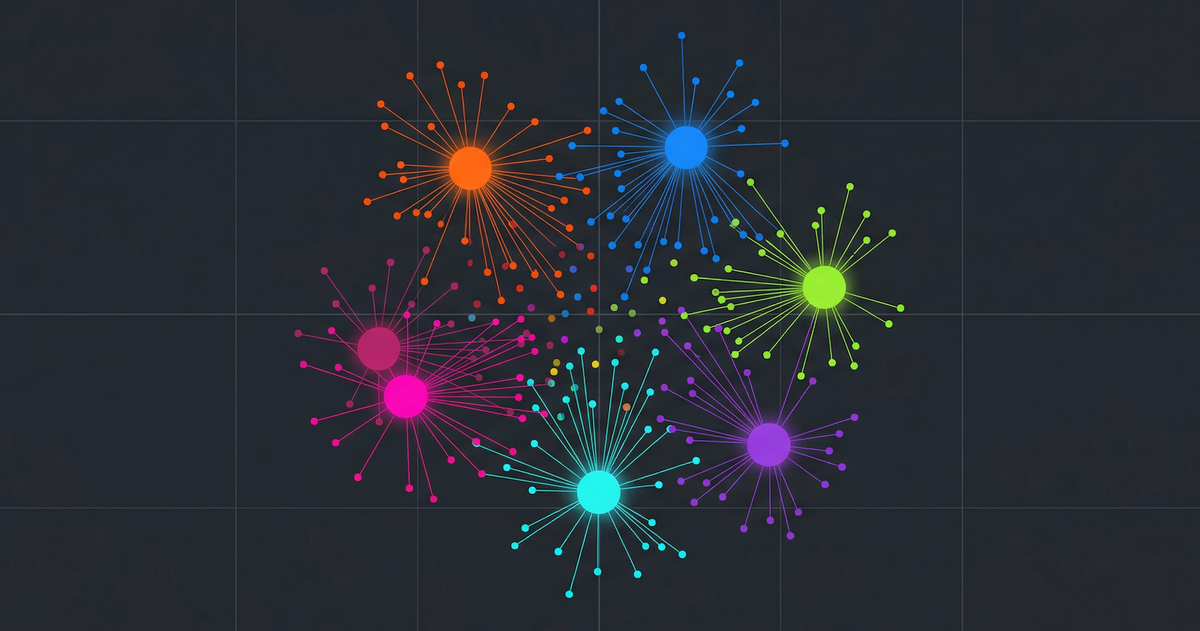
How K-Means Clustering Works (Explained by Extracting Colors from Images)
Every color palette extractor you’ve used runs K-Means clustering. Coolors, Canva, Adobe. They all use the same algorithm to find dominant colors. Most of them run it on a server. Ours runs it on your GPU, entirely in the browser.
K-Means tutorials usually go one of two ways. They either drown you in math notation or tell you to pip install scikit-learn and call it a day. Neither helps you understand what’s actually happening inside the algorithm.
This post walks through K-Means step by step, using color extraction as the running example. Then we’ll look at the 15-line fragment shader that runs the whole thing on your GPU.
TL;DR: K-Means clustering groups data points by repeatedly assigning them to the nearest centroid and recalculating. Applied to image pixels, it finds dominant colors. Our Palette Extractor runs the entire algorithm on the GPU via WebGL2 fragment shaders, processing every pixel in parallel with zero server uploads. GPU-accelerated K-Means can achieve up to 150x speedup over CPU implementations (Springer, 2025).
What Is K-Means Clustering?
K-Means is the most widely used clustering algorithm in machine learning (IBM). It partitions N data points into K groups by minimizing the distance between each point and its cluster’s center.
Here’s the intuition. Imagine you have a massive pile of colored beads. Thousands of them, every shade imaginable. You want to sort them into exactly 6 jars, where each jar holds beads of similar color. You don’t have labels. You don’t know what the 6 colors should be yet. You just know you want 6 groups.
That’s K-Means. K is the number of jars. The algorithm figures out which beads go where.
It’s unsupervised. No labeled training data needed. It scales linearly at O(n), unlike many clustering algorithms that run at O(n²) (scikit-learn). That’s why it’s everywhere: market segmentation, document clustering, image compression, and color palette extraction.
How Does K-Means Work? Five Steps, No Math
The algorithm repeats just two operations: assign points to the nearest centroid, then move the centroid to the mean. It loops until nothing changes. That’s it. Let’s walk through each step with color extraction as the example.
Step 1: Choose K
K is the number of clusters you want. For color extraction, it’s your palette size. Want 6 dominant colors? Set K=6. Want 3? Set K=3. You decide this upfront.
There’s a technique called the “elbow method” for finding the optimal K. For color palettes, it doesn’t matter. You pick K based on how many colors you want.
Step 2: Initialize Centroids
The algorithm needs K starting points. Our tool picks K random pixels from the image as the initial centroids. These first guesses are almost certainly wrong. That’s fine. The algorithm fixes them.
K-Means++ is a smarter initialization that spaces out the starting centroids. We skip it. Random init is faster and converges to a good-enough result for color extraction.
Step 3: Assign Every Point
Now every pixel in the image looks at all K centroids and asks: which one is closest to my color?
It measures Euclidean distance in RGB space: the straight-line distance between two colors when you treat R, G, and B as coordinates. Each pixel “snaps” to the nearest centroid.
This is the expensive step. For a 256x256 image, that’s 65,536 pixels, each calculating distance to K centroids. Every single iteration. But it’s also the step that’s embarrassingly parallel. No pixel needs to know about any other pixel. Remember that. It’s why the GPU matters.
Step 4: Update Centroids
Each centroid now has a group of pixels assigned to it. It calculates the average color of its group (the mean R, mean G, mean B) and moves to that position.
The centroid now represents the true average color of its cluster. But because it moved, the boundaries shifted. Some pixels might now be closer to a different centroid.
Step 5: Repeat Until Convergence
Loop steps 3 and 4. Assign, update, assign, update. Each iteration, the centroids move less. Pixels stop switching clusters.
When no centroid moves more than a threshold (we use 0.001), the algorithm has converged. Our tool caps at 50 iterations, but typical images converge in 5–15 cycles.
The final centroid positions are your palette colors. The number of pixels in each cluster tells you how dominant that color is.
Why Is Color Extraction the Perfect K-Means Demo?
Color quantization is one of the oldest applications of K-Means, dating back to Paul Heckbert’s 1982 median cut paper. But most tutorials still teach it with synthetic scatter plots. Randomly generated dots on a 2D graph. You stare at abstract points and try to imagine the algorithm working. It’s disconnected from anything real.
Color extraction is different. The data points are pixels, and pixels are visual. You can literally see the clusters. When a centroid represents “dark blue,” you know what that means. When 34% of pixels cluster around it, you can see that the image is mostly dark blue.
RGB values form a 3D coordinate space. Red is one axis, Green another, Blue the third. Every pixel occupies a position in this cube. K-Means finds the K regions in this cube where pixels clump together most densely. The centroid of each region becomes a palette color.
Don’t take our word for it. Try it yourself. Drop an image into the tool below and watch K-Means run in real time. The interactive explainer on the left maps pixel Red to the X axis and Green to the Y axis, giving you a 2D projection of color space. Points get colored outlines when assigned to a cluster. Centroid circles drift toward their group’s center. The whole thing converges in seconds.
You’re watching machine learning happen. On your data. In your browser.
How Do You Run K-Means on a GPU in the Browser?
The assignment step (Step 3) is embarrassingly parallel. Each pixel calculates its distance to every centroid independently. Pixel #1 doesn’t need to know what pixel #42,000 is doing. Every computation is identical in structure, just different in input data.
That’s exactly what GPUs are built for. A GPU runs thousands of tiny programs (shaders) simultaneously, one per pixel. What takes JavaScript a sequential loop over 65,536 pixels, a fragment shader does all at once.
Our finding: When we first tried running K-Means in JavaScript on the CPU, anything above 256x256 pixels was noticeably slow. Moving the assignment step to a WebGL2 fragment shader made it instant.
WebGL2 is supported in 92% of browsers (LambdaTest, 2025). It’s not new tech. It’s the rendering API behind every 3D web experience. But we’re not rendering 3D graphics. We’re abusing the rendering pipeline for general-purpose computation. This technique is called GPGPU (General-Purpose GPU computing), and it predates WebGPU by years (WebGL Fundamentals).
The trick: pack pixel RGB values into an RGBA32F floating-point texture. Feed it to a fragment shader. The shader runs once per texel (one per pixel), computes the nearest centroid, and writes the result. The GPU handles all 65,536 computations in parallel.
The Fragment Shader (15 Lines That Do the Work)
Here’s the actual shader from our Palette Extractor. Not pseudocode. This is the production code running when you upload an image:
#version 300 es
precision highp float;
uniform sampler2D u_data;       // pixel colors as texture
uniform vec3 u_centroids[32];   // current centroid positions
uniform int u_k;                // number of clusters
uniform int u_numPoints;        // total pixel count
out vec4 outColor;

void main() {
  ivec2 texCoord = ivec2(gl_FragCoord.xy);
  int texWidth = textureSize(u_data, 0).x;
  int idx = texCoord.y * texWidth + texCoord.x;
  if (idx >= u_numPoints) { outColor = vec4(-1.0); return; }

  vec3 pt = texelFetch(u_data, texCoord, 0).rgb;  // this pixel's color
  float minDist = 999999.0;
  float bestK = -1.0;

  for (int i = 0; i < 32; i++) {
    if (i >= u_k) break;
    float d = distance(pt, u_centroids[i]);        // euclidean distance
    if (d < minDist) { minDist = d; bestK = float(i); }
  }

  outColor = vec4(bestK, pt.r, pt.g, pt.b);       // cluster index + original color
}
This runs once per pixel, simultaneously across thousands of GPU cores. The input is a texture containing every pixel’s color. The output is the cluster assignment (which centroid is nearest) plus the original color packed into a single RGBA value.
GPU implementations of K-Means achieve over 100x speedup compared to CPU at scale (Springer, 2022). In our case, the dataset is “only” 65K pixels, small by GPU standards. But the speedup is still dramatic because JavaScript’s sequential loop has no chance against parallel shader execution.
What Stays on the CPU? The Hybrid Loop
Assignment parallelizes perfectly on the GPU. But centroid update (Step 4) requires summing all pixels per cluster, an aggregation that’s actually faster on the CPU for small K values.
Here’s the per-iteration flow in our implementation:
- CPU uploads centroid positions as shader uniforms (
gl.uniform3fv) - GPU runs the fragment shader across all pixels (
gl.drawArrays) - CPU reads results back from the GPU (
gl.readPixels). This is the bottleneck - CPU loops through results, accumulating sums and counts per cluster
- CPU divides sums by counts to get new centroid positions
- Check: if no centroid moved more than 0.001, stop. Otherwise, go to step 1.
readPixels is the expensive part. It’s a GPU-to-CPU memory transfer that stalls the pipeline. Still worth it. The parallelized assignment step saves far more time than the transfer costs.
Real Numbers from Our Tool
The Palette Extractor displays iteration count and timing after every extraction. Here’s what we typically see:
- 256x256 image, K=6: 5–8 iterations, 8–15ms total
- 256x256 image, K=12: 8–12 iterations, 15–25ms total
- Smaller images converge faster: fewer pixels means less GPU work per iteration
You can verify this yourself. Scroll back up to the embedded tool and check the stats bar below the results. The iteration count and millisecond timing are displayed for every extraction.
The 50-iteration cap exists as a safety net. We’ve never seen an image that needed more than 20 iterations to converge.
What Else Can K-Means Do?
K-Means is used far beyond image processing. A 2022 survey found it’s the most studied and applied clustering algorithm across all domains of computer science (ScienceDirect). The algorithm is identical everywhere. Only the “distance” changes.
Customer segmentation: Replace pixel RGB with behavioral data (spending, frequency, recency). Centroids become customer archetypes. Marketing teams use this to target campaigns.
Document clustering: Replace colors with word frequency vectors. Documents with similar vocabulary cluster together. Search engines use this for result deduplication.
Anomaly detection: Points far from all centroids are outliers. If a pixel’s color is wildly different from every cluster center, it’s anomalous. Credit card fraud detection uses this principle.
Image compression: Replace every pixel with its centroid’s color. A 16-million-color image becomes a K-color image. At K=32, most photos are visually indistinguishable from the original but dramatically smaller.
The interactive explainer in our Palette Extractor works the same whether the dots represent pixel colors or customer behaviors. The visualization is universal. Only the axes change.
Frequently Asked Questions
What does K mean in K-Means?
K is the number of clusters you want the algorithm to find. In color extraction, K is your palette size. K=6 extracts 6 dominant colors, K=3 extracts 3. You choose K before running the algorithm. There’s no single “correct” K; it depends on your use case.
Is K-Means deterministic?
No. Random centroid initialization means different runs can produce slightly different results. Try the tool above twice on the same image and you might get marginally different colors. K-Means++ improves consistency by spacing initial centroids apart, but adds overhead. We use random init for speed.
Why use the GPU instead of JavaScript?
The assignment step checks every pixel against every centroid. For a 256x256 image with K=6, that’s 65,536 x 6 = 393,216 distance calculations per iteration. In JavaScript, that’s a sequential loop. On the GPU, all 65,536 pixels compute simultaneously. GPU K-Means achieves 100x+ speedup at scale (Springer, 2022).
Does this work on mobile browsers?
Yes, if the device supports WebGL2 with the EXT_color_buffer_float extension. Most smartphones from 2018 onward do. The tool checks for support at startup and shows a message if your device can’t run it.
How is K-Means different from median cut?
Median cut recursively splits the color space in half along the axis with the widest range. K-Means iteratively refines cluster centers toward the actual average color of each group. K-Means usually produces more perceptually balanced palettes because centroids converge to true color means, not arbitrary split boundaries.
Wrapping Up
K-Means is deceptively simple. Assign every point to the nearest centroid. Move the centroid to the mean. Repeat.
Applied to image pixels, it becomes a color palette extractor. Applied to customer data, it becomes a segmentation engine. The algorithm doesn’t care what the data represents. It finds groups.
The GPU makes it fast enough to run interactively in a browser. A 15-line fragment shader replaces a sequential JavaScript loop with thousands of parallel computations.
- K-Means finds groups by minimizing distance to cluster centers
- Color extraction is K-Means where data points are pixel RGB values
- WebGL2 fragment shaders run the assignment step across all pixels simultaneously
- The whole thing runs in your browser, no server, no uploads
Try the embedded tool above, or open the full Palette Extractor for the complete experience with the interactive K-Means step-by-step visualizer.
For more on how we optimize browser-based tools for performance, see how we achieved 60fps video playback using a similar approach: bypass the framework, go straight to the hardware. And if you’re editing video, check out Velocaption’s silence removal and auto-captioning.
Keep the edit on your Mac.
Choose a license to record, clean, caption, and export without moving private footage into a browser editor.